Process-Graph Your Tasks
If you want to model the task structure of a given project, it can make sense to list all the different tasks and subtasks, all the recurring processes that project consists of. But how can you best communicate the details of your task network?
The Task-Process Graph
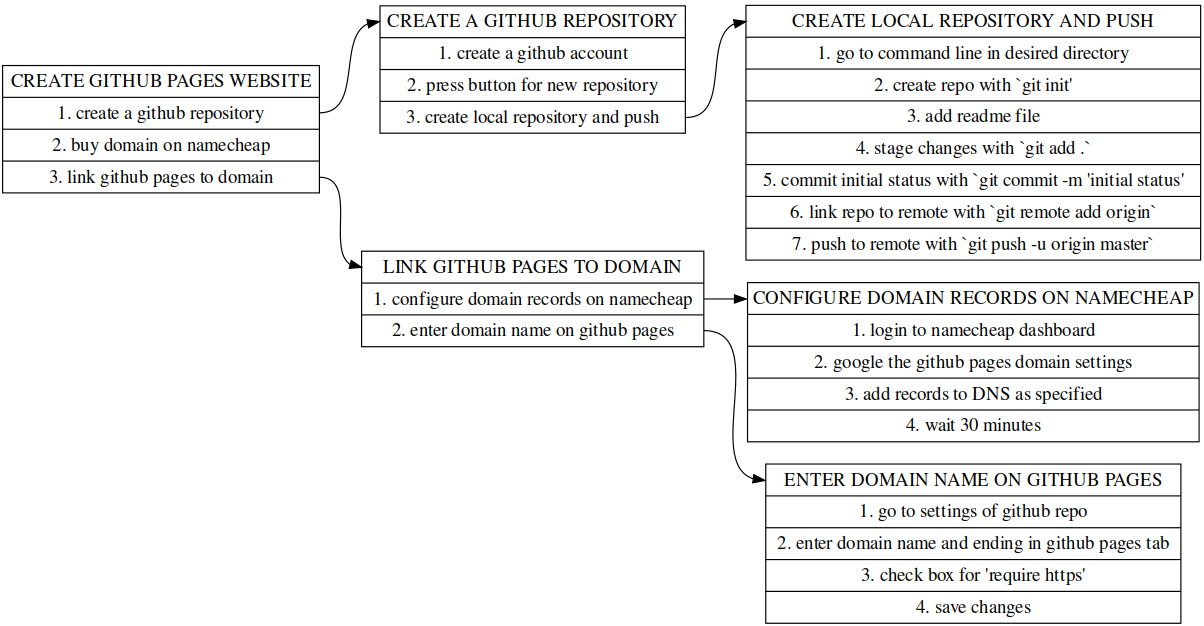
For a data structure that can represent interconnected tasks and steps, we need a collection of lists and connecting arrows:
In the above task-process graph, specific cells, or task steps, of the task nodes are connected in a flow to show what substeps pertain to which tasks, and which substeps are shared by which tasks in a many-to-one relationship.
Drawing Tools
You can generate this data structure using DOT graphs and the record node style.
For example online, with this great website (code to the sample chart included):
dreampuf.github.io/GraphvizOnline. Alternatively, there is a Graphviz extension available for the programming environment, VSCode.
Another option could be to draw and connect the nodes from scratch with the amazing diagramming tool, draw.io.
And don’t forget pen and paper :grin:
Brian Junker-Latocha