Code Your Flow: Write the Logic, Render the Image
Create elegant flowcharts in Graphviz without worrying about layout.
By defining flows as text, you can focus on the logic and let the rendering engine take care of the rest. Plus, you can take full advantage of version control to pinpoint changes and diffs.
The Graphviz framework was developed by AT&T Labs Research as an open-source tool package for modeling and representing graphs textually.
The DOT language is the reasonably intuitive markup language used to define the graphs.
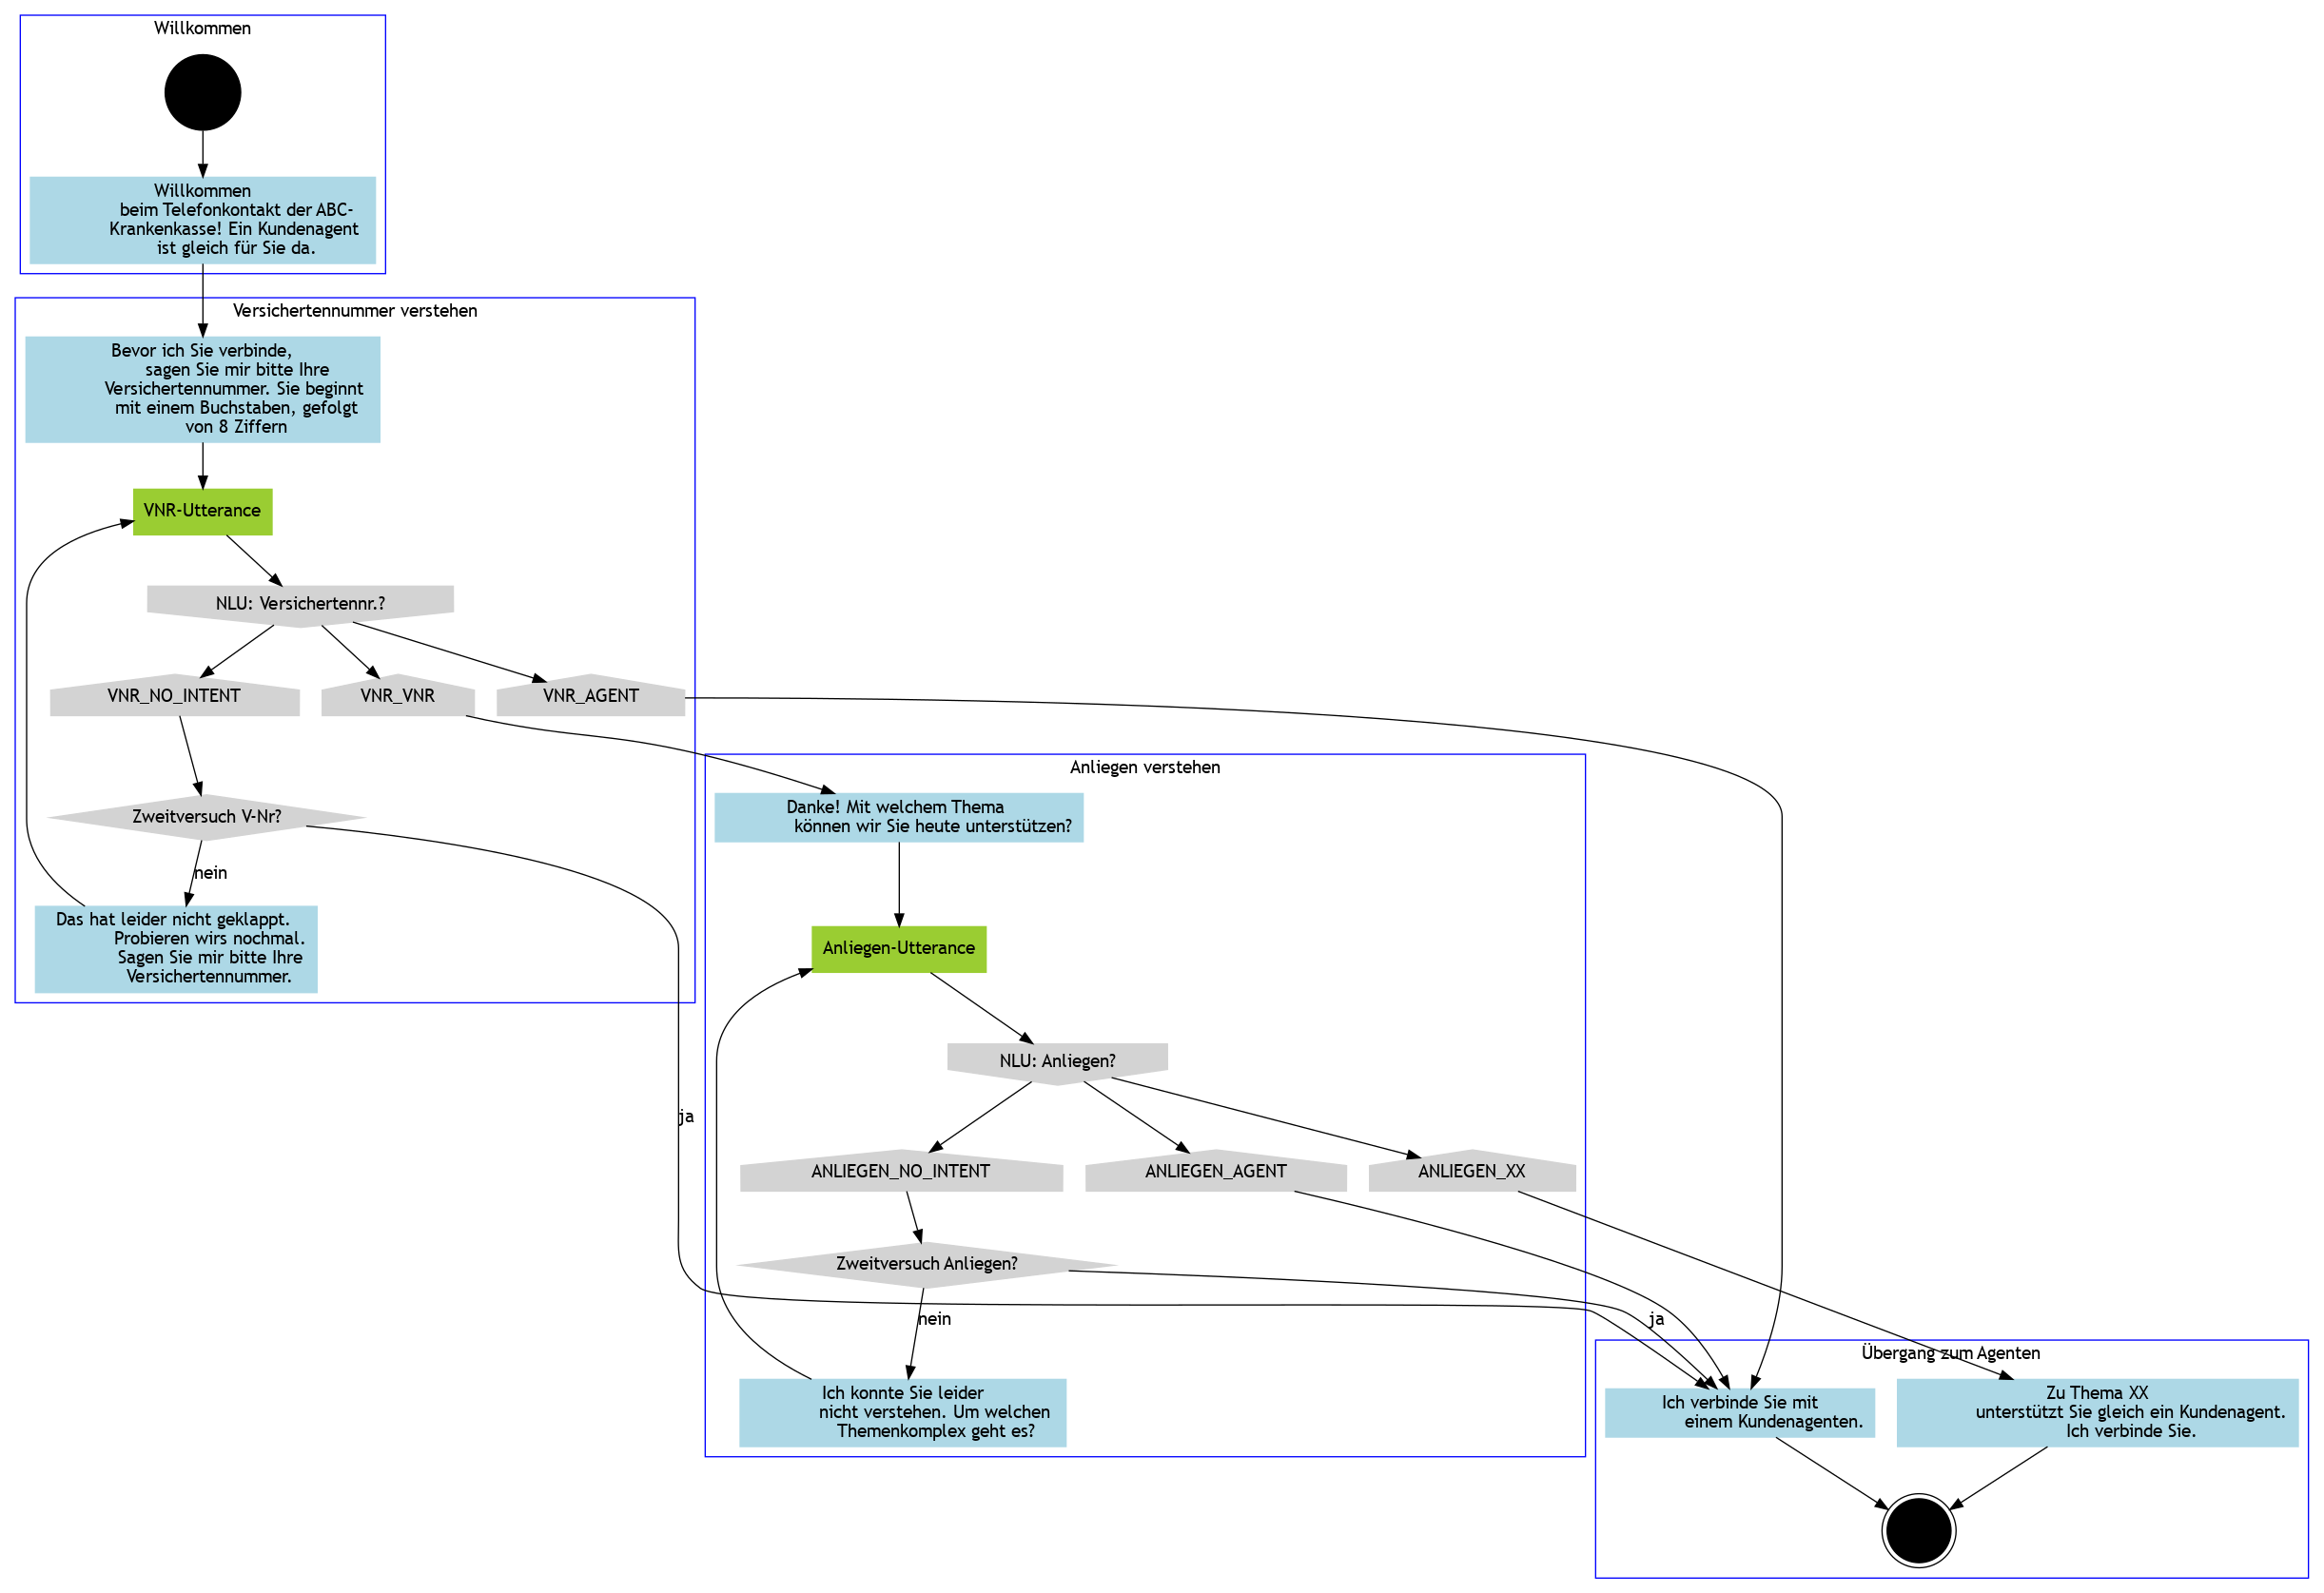
Flowcharting in Graphviz
The basic concept behind flowcharting in Graphviz is to first define your nodes, and then describe the connections they have between each other.
By separating the logical aspect of flow writing from the visual aspect, you can focus on the data and avoid the distraction of layout adjustment.
Define nodes
The first part of creating a code-based flow is to define your nodes’ shape, color and contents. Each node is declared on a new line and given a unique name.
Certain keywords, like node, are universal keywords, whose styling is applied to all nodes thereafter (until redefined).
The very first line of the graph denotes that the data below will form a directional graph, or digraph, and is necessary for the renderer to work right. The graph type is followed by a unique name.
digraph tel_flow {


// NODE DEFINITIONS
    // start nodes
    // this definition also includes graph-wide definitions for fill and font
    node[style=filled,shape=circle,color=black,fontname="Work Sans Light 300"]
        start[shape=circle,color=black]

    // end nodes
    node[shape=doublecircle,color=black]
        end[shape=doublecircle,color=black]

    // prompt nodes
    node[shape=box,color=lightblue]
        prompt_welcome[label="Willkommen
            beim Telefonkontakt der ABC-
            Krankenkasse! Ein Kundenagent
            ist gleich für Sie da."]
        prompt_vnr[label="Bevor ich Sie verbinde,
            sagen Sie mir bitte Ihre
            Versichertennummer. Sie beginnt
            mit einem Buchstaben, gefolgt
            von 8 Ziffern"]
        prompt_vnr_fail[label="Das hat leider nicht geklappt.
            Probieren wirs nochmal.
            Sagen Sie mir bitte Ihre
            Versichertennummer."]
        prompt_vnr_success[label="Danke! Mit welchem Thema
            können wir Sie heute unterstützen?"]
        prompt_anliegen_success[label="Zu Thema XX
            unterstützt Sie gleich ein Kundenagent.
            Ich verbinde Sie."]
        prompt_connect_agent[label="Ich verbinde Sie mit
            einem Kundenagenten."]
        prompt_nicht_verstanden_anliegen[label="Ich konnte Sie leider
            nicht verstehen. Um welchen
            Themenkomplex geht es?"]

    // utterance nodes
    node[shape=box,color=yellowgreen]
        utterance_vnr[label="VNR-Utterance"]
        utterance_anliegen[label="Anliegen-Utterance"]

    // nlu nodes
    node[shape=invhouse,color=lightgray]
        nlu_vnr[label="NLU: Versichertennr.?"]
        nlu_anliegen[label="NLU: Anliegen?"]

    // intent nodes
    node[shape=house,color=lightgray]
        intent_vnr_no_intent[label="VNR_NO_INTENT"]
        intent_vnr_agent[label="VNR_AGENT"]
        intent_vnr_vnr[label="VNR_VNR"]
        intent_anliegen_no_intent[label="ANLIEGEN_NO_INTENT"]
        intent_anliegen_agent[label="ANLIEGEN_AGENT"]
        intent_anliegen_xx[label="ANLIEGEN_XX"]

    // logic nodes
    node[shape=diamond,color=lightgray]
        logic_zweitversuch_vnr[label="Zweitversuch V-Nr?"]
        logic_zweitversuch_anliegen[label="Zweitversuch Anliegen?"]
Define Relationships
Next, the predefined nodes need to be connected to eath other with arrows. To make the flow clearer, subgraphs can be used to cluster nodes that belong to the same task or component.
The -> arrow represents the direction of the connnection between the node names before and after it. Just like with the nodes, the connections can also have labels, defineable in brackets.
The subgraphs represent the big blue boxes in the image, and can also be styled with different colors, rounding, labels, etc. These are the values followed by equals signs. Pro tip: Subgraph names must start with “cluster”.
// SUBGRAPH AND CONNECTION DEFINITIONS

subgraph cluster_welcome {
    label = "Willkommen"
    color = blue
    start -> prompt_welcome

}

subgraph cluster_vnr {
    label = "Versichertennummer verstehen"
    color = blue
    prompt_welcome -> prompt_vnr
    utterance_vnr -> nlu_vnr
    nlu_vnr -> intent_vnr_agent
    nlu_vnr -> intent_vnr_vnr
    nlu_vnr -> intent_vnr_no_intent
    intent_vnr_no_intent -> logic_zweitversuch_vnr
    prompt_vnr -> utterance_vnr
    logic_zweitversuch_vnr -> prompt_vnr_fail [label="nein"]
    prompt_vnr_fail -> utterance_vnr

}


subgraph cluster_anliegen {
    label = "Anliegen verstehen"
    color = blue
    prompt_vnr_success -> utterance_anliegen
    utterance_anliegen -> nlu_anliegen
    nlu_anliegen -> intent_anliegen_xx
    nlu_anliegen -> intent_anliegen_agent
    nlu_anliegen -> intent_anliegen_no_intent
    intent_anliegen_no_intent -> logic_zweitversuch_anliegen
    logic_zweitversuch_anliegen -> prompt_nicht_verstanden_anliegen [label="nein"]
    prompt_nicht_verstanden_anliegen -> utterance_anliegen
    intent_vnr_vnr -> prompt_vnr_success


}
subgraph cluster_to_agent {
    label = "Übergang zum Agenten"
    color = blue
    logic_zweitversuch_vnr -> prompt_connect_agent [label="ja"]
    logic_zweitversuch_anliegen -> prompt_connect_agent [label="ja"]
    intent_vnr_agent -> prompt_connect_agent
    intent_anliegen_agent -> prompt_connect_agent
    intent_anliegen_xx -> prompt_anliegen_success
    prompt_anliegen_success -> end
    prompt_connect_agent -> end


}

}
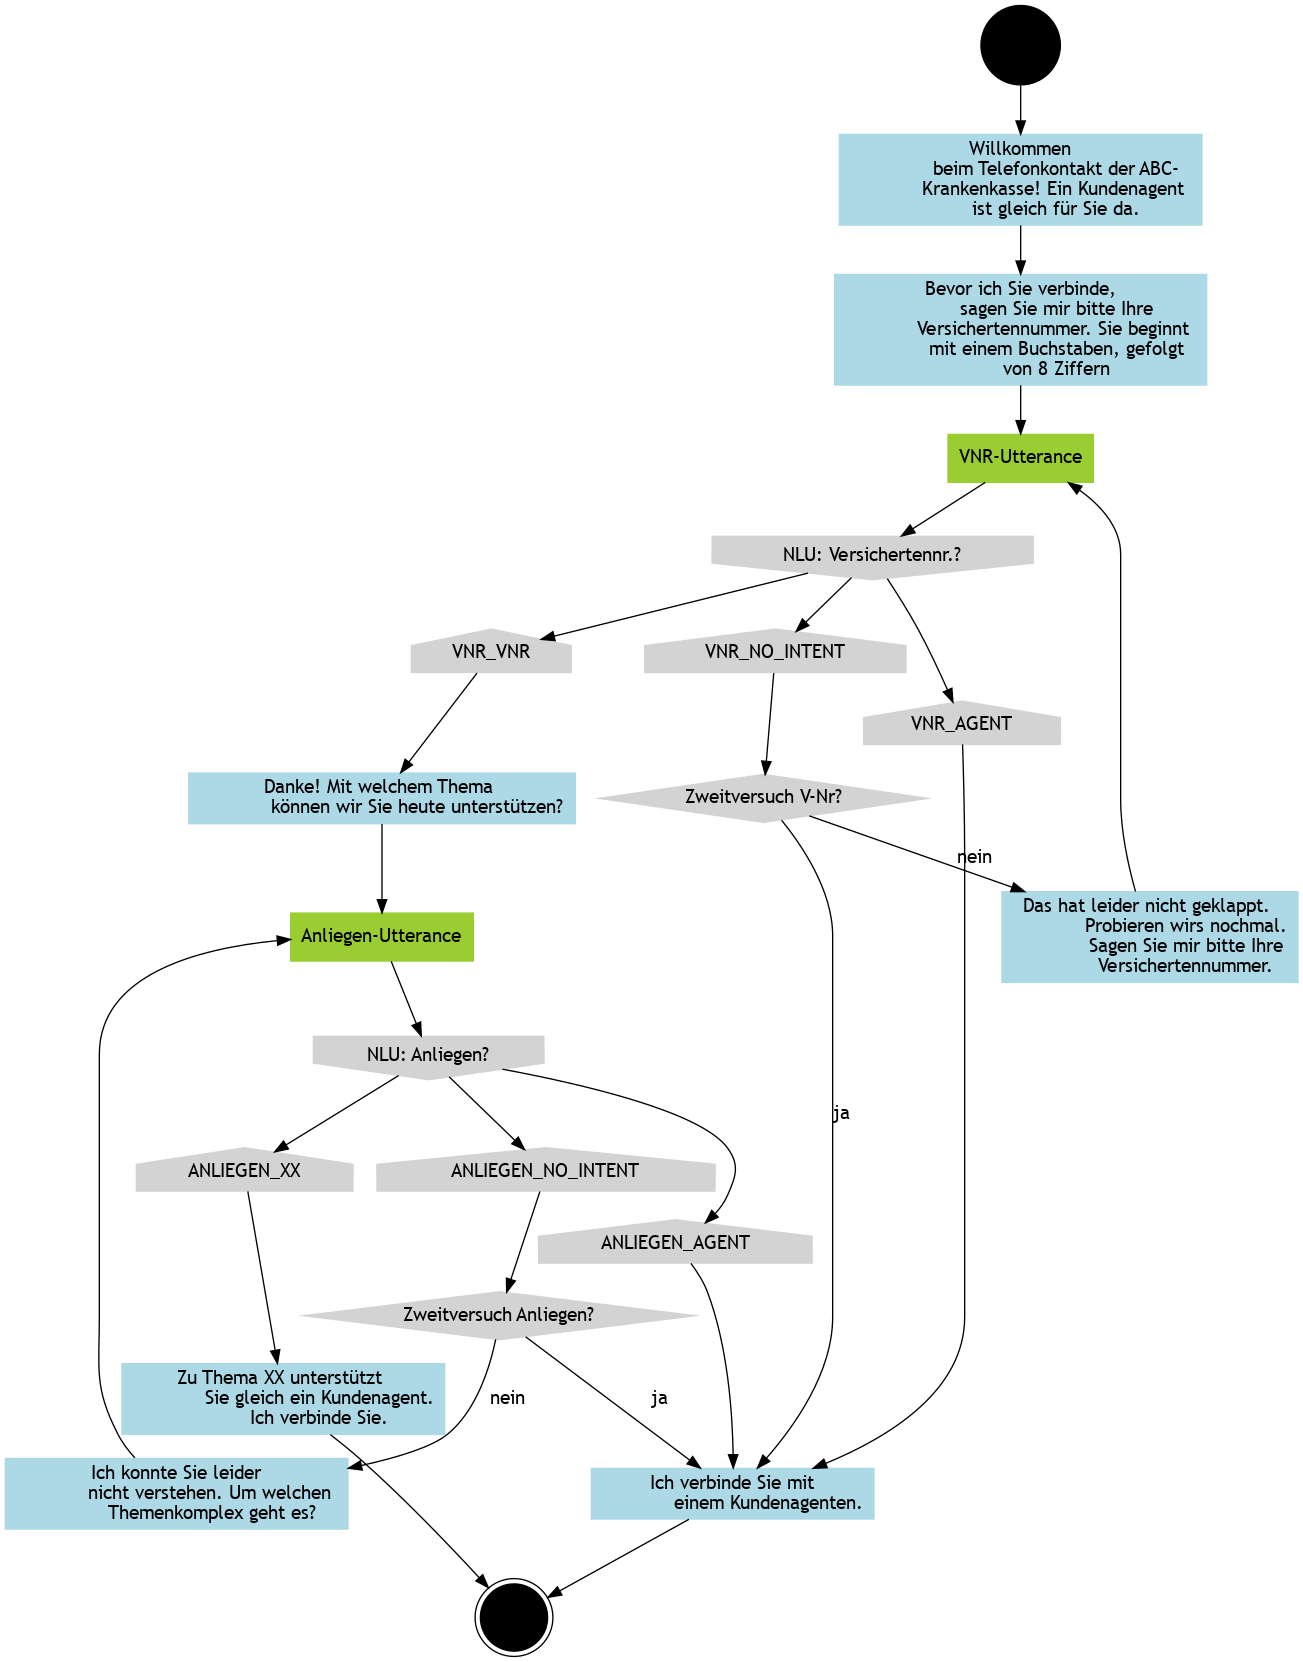
Using subgraphs causes subgraphs to be layouted individually. Here is the above example as one single graph:
Arterial Flow Charts
Plotting a chart of all the possible tips and turns of the flow paths is well and good. But if you’re trying to make business decisions about the user journeys most central to your business goals, what information does the standard flow chart offer to support?
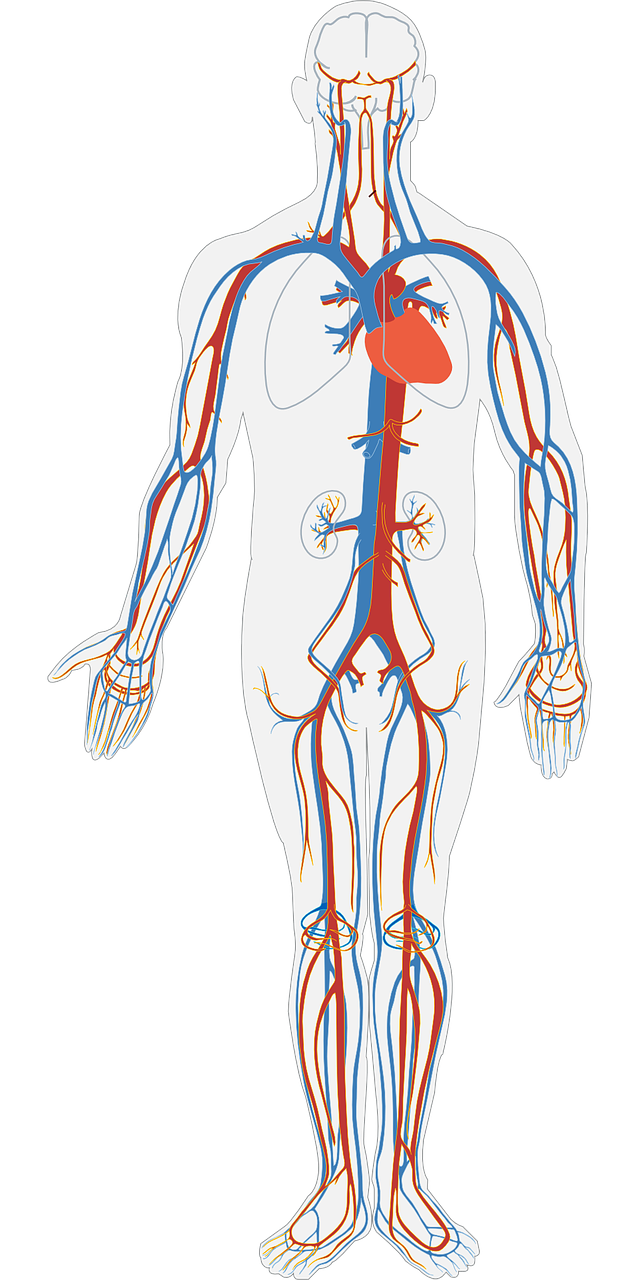
Imagine trying to understand the human vascular system without an indication of how big each blood vessel is: you would have no idea about how much traffic is going through the various pipelines, and they all would appear equally important.
But they’re not.
So help business deciders prioritize user journeys by telling them which flow paths are the most important– visually.
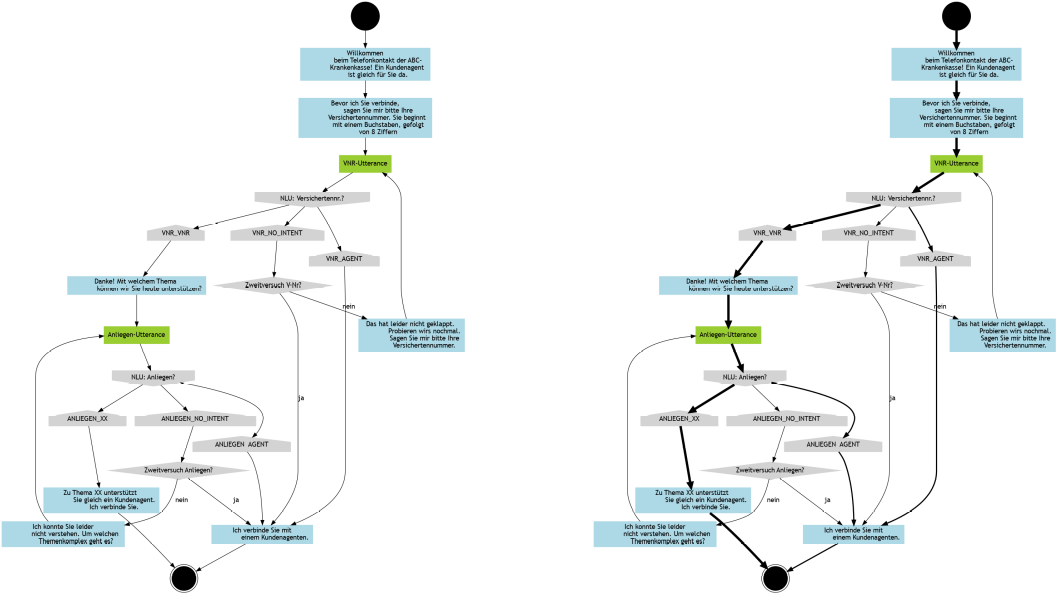
Click the above image to download the example arterial flow, or just use the edge[penwidth=1] label above the edges you want to make thicker or thinner.
Rendering the Image
VScode, with the Graphviz Preview extension, is a great tool for creating Graphviz graphs that allows you to render in a parallel window as you type.
But if you want to try out Graphviz without installing anything, just go to the online Graphviz editor, dreampuf.github.io.
If you want to go the VScode route, youll first need to install graphviz on your system.
Then, all you need to do is create your graph file with a .dot ending in VScode and then run the command Graphviz: Open Preview to the Side using CTRL/CMD-SHIFT-P.
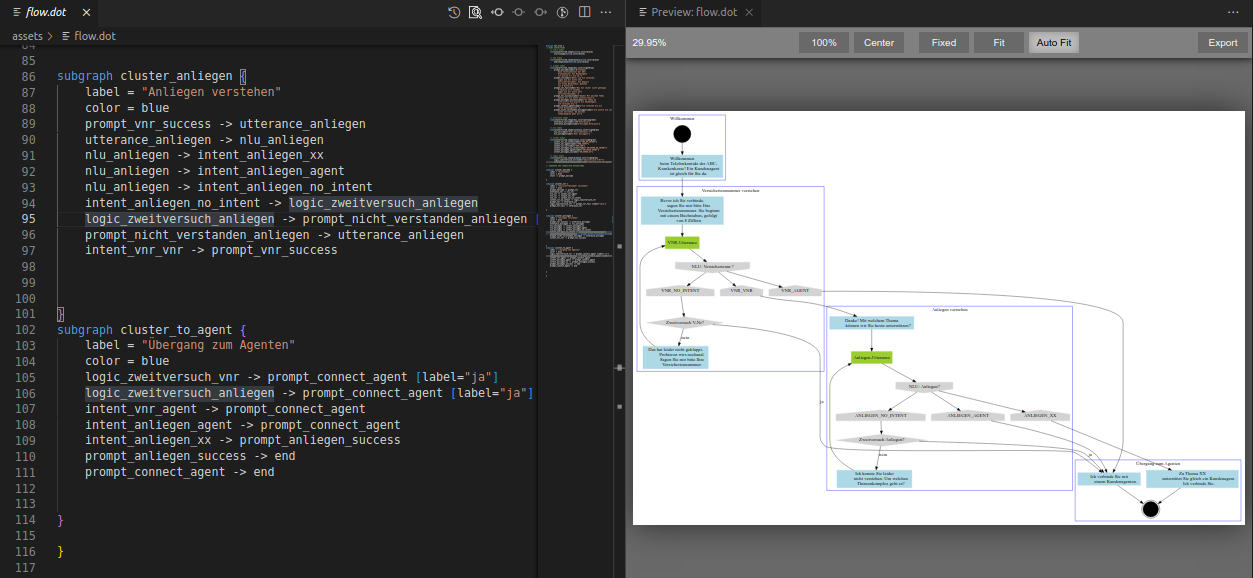
From this screen, you can export to the file format of your choice.
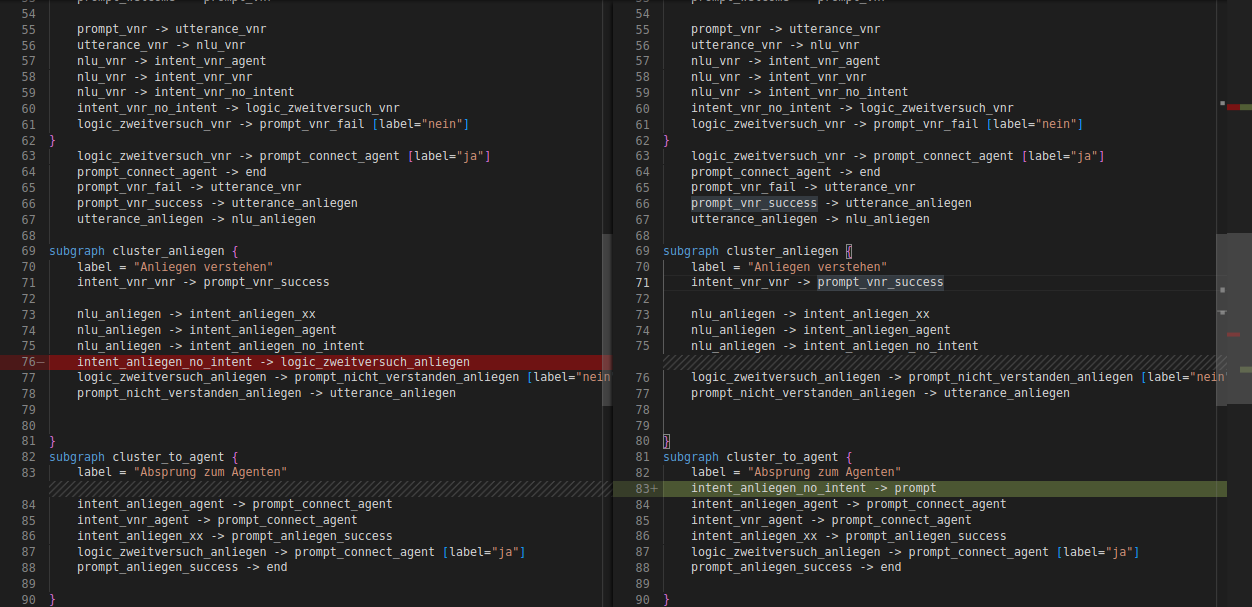
Develop Collaboratively and Easily Inspect Diffs
In VScode, you can use git to track versions of your graph as you develop and change it. Additionally, you can use the compare diff functionality to see exactly what part of the graph was changed in each version.
Conclusion
Creating flowcharts from code is a great way to focus your thoughts on the raw flow structure itself. But it also takes the visual tidying work off your shoulders, and makes collaboration easier by enabling line-for-line comparability of versions.
Brian Junker-Latocha