X-Ray Your Team with Graphviz
 A team’s lines of communication make up its organizational backbone for getting tasks done.
By mapping your contacts to your most important tasks and topics, you can visualize how information flows between you and team members, and better explain to others your role in the project.
A team’s lines of communication make up its organizational backbone for getting tasks done.
By mapping your contacts to your most important tasks and topics, you can visualize how information flows between you and team members, and better explain to others your role in the project.
Enter DOT Graph Language and Graphviz
The DOT graph language and Graphviz provide a protocol for recording network-structured relationships between elements.
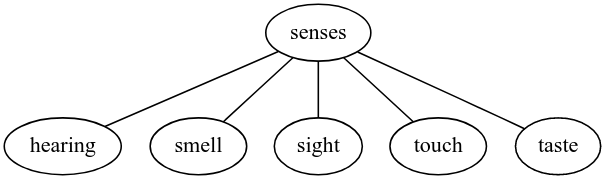
In its simplest form, DOT provides a framework for connecting nodes, denoted by single words, with edges, denoted by the double dash (--). A simple undirected graph could look like this:
graph graph1 {
	hearing -- sight;
	sight -- taste;
	taste -- hearing;
	hearing -- touch;
	touch -- taste;
}
The Contact-Task Graph
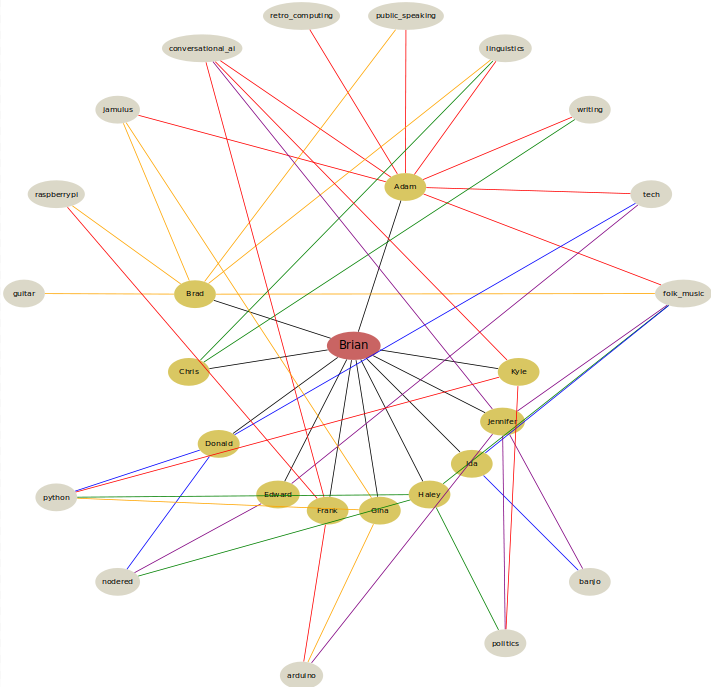
To go from a simple network graph to a contact-task graph, we need a network plotter that will enable a radial rendering of several (three) layers of nodes, represented in concentric circles. For this, DOT’s twopi layout comes in handy.
Along with some additional node coloring and font settings metadata, the raw data of the contact graph is stored in the below text file. Note that the metadata is set at the beginning, and also includes the specification of the root node. The ring levels of nodes are defined by the separate mappings of the root node to the contact-person nodes, as well as the contact-person nodes to the task nodes. For clarity, the edge lines are shown in alternating rainbow colors. Don’t worry about the numbers with hashtags, those are just a notation for a more exact color.
Also, if your nodes get too close together because you have so many, try adjusting the ranksep value higher.
graph contacts_tasks {
	fontname=Arial;
	layout=twopi;
	graph [ranksep=3] [overlap=true][root=Brian];
	edge [penwidth=1 color="#000000"]
	node [fontname=Bahnschrift]
	node [style="filled" fontsize=15 penwidth=0 fillcolor="#c96463"]
	Brian -- {
		node [style="filled" fontsize= 10 penwidth=0 fillcolor="#d9c762"]
		Adam
		Brad
		Chris
		Donald
		Edward
		Frank
		Gina
		Haley
		Ida
		Jennifer
		Kyle

	}
	node [style="filled" fontsize= 15 penwidth=0 fillcolor="#d9c762"]
	edge [color=red]
	Adam -- {
		node [style="filled" fontsize= 10 penwidth=0 fillcolor="#dbd8c8"]
		folk_music
		tech
		writing
		linguistics
		public_speaking
		retro_computing
		conversational_ai
		jamulus


	}
	edge [color=orange]
	Brad -- {
		node [style="filled" fontsize= 10 penwidth=0 fillcolor="#dbd8c8"]
		folk_music
		raspberrypi
		guitar
		jamulus
		linguistics
		public_speaking
	}
	edge [color=green]
	Chris -- {
		node [style="filled" fontsize= 10 penwidth=0 fillcolor="#dbd8c8"]
		writing
		linguistics
	}
	edge [color=blue]
	Donald -- {
		node [style="filled" fontsize= 10 penwidth=0 fillcolor="#dbd8c8"]
		tech
		python
		nodered
	}
	edge [color=purple]
	Edward-- {
		node [style="filled" fontsize= 10 penwidth=0 fillcolor="#dbd8c8"]
		nodered
		tech
	}
	edge [color=red]
	Frank -- {
		node [style="filled" fontsize= 10 penwidth=0 fillcolor="#dbd8c8"]
		raspberrypi
		arduino
		conversational_ai
	}
	edge [color=orange]
	Gina -- {
		node [style="filled" fontsize= 10 penwidth=0 fillcolor="#dbd8c8"]
		arduino
		python
		jamulus
	}
	edge [color=green]
	Haley -- {
		node [style="filled" fontsize= 10 penwidth=0 fillcolor="#dbd8c8"]
		folk_music
		python
		nodered
		politics
	}
	edge [color=blue]
	Ida -- {
		node [style="filled" fontsize= 10 penwidth=0 fillcolor="#dbd8c8"]
		folk_music
		banjo
	}
	edge [color=purple]
	Jennifer -- {
		node [style="filled" fontsize= 10 penwidth=0 fillcolor="#dbd8c8"]
		arduino
		politics
		banjo
		folk_music
		conversational_ai

	}
	edge [color=red]
	Kyle -- {
		node [style="filled" fontsize= 10 penwidth=0 fillcolor="#dbd8c8"]
		politics
		python
		conversational_ai
	}

}
The final product can be used to map both team members to the tasks you collaborate on, and tasks to the team members involved:
Wait a minute, how did you go from file to image?
You can generate DOT graphs online with this great website: dreampuf.github.io/GraphvizOnline:
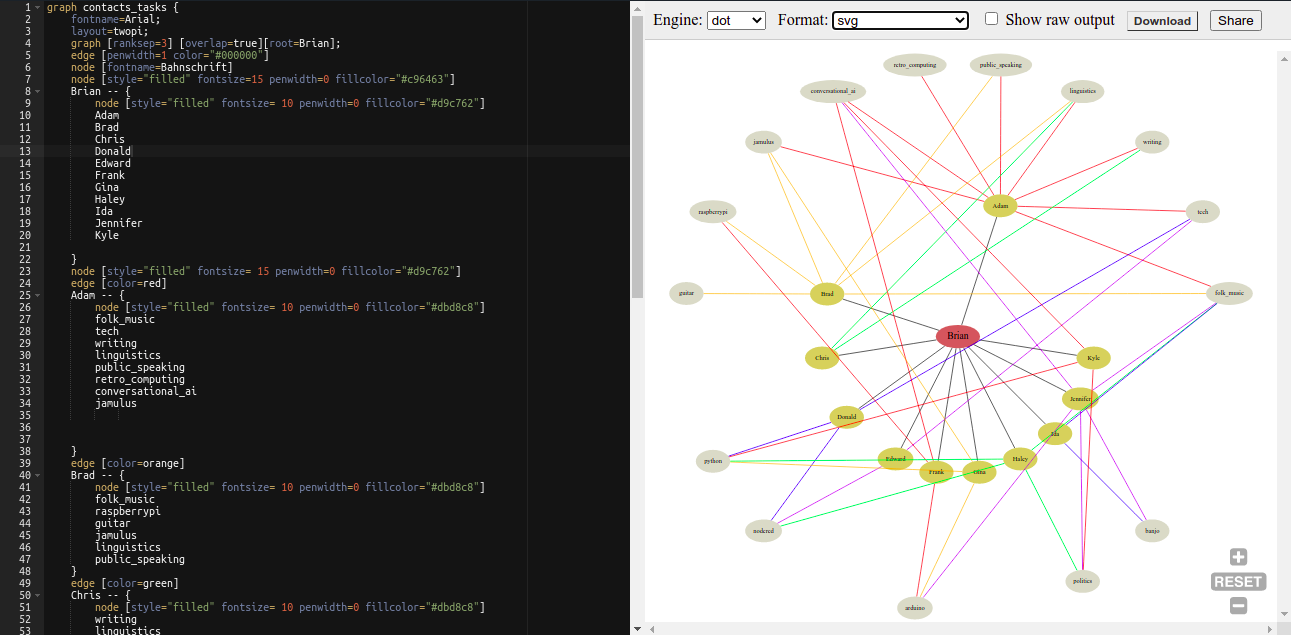
Alternatively, there is a great extension available for the programming environment, VSCode.
Brian Junker-Latocha